自制二氧化碳监测平台

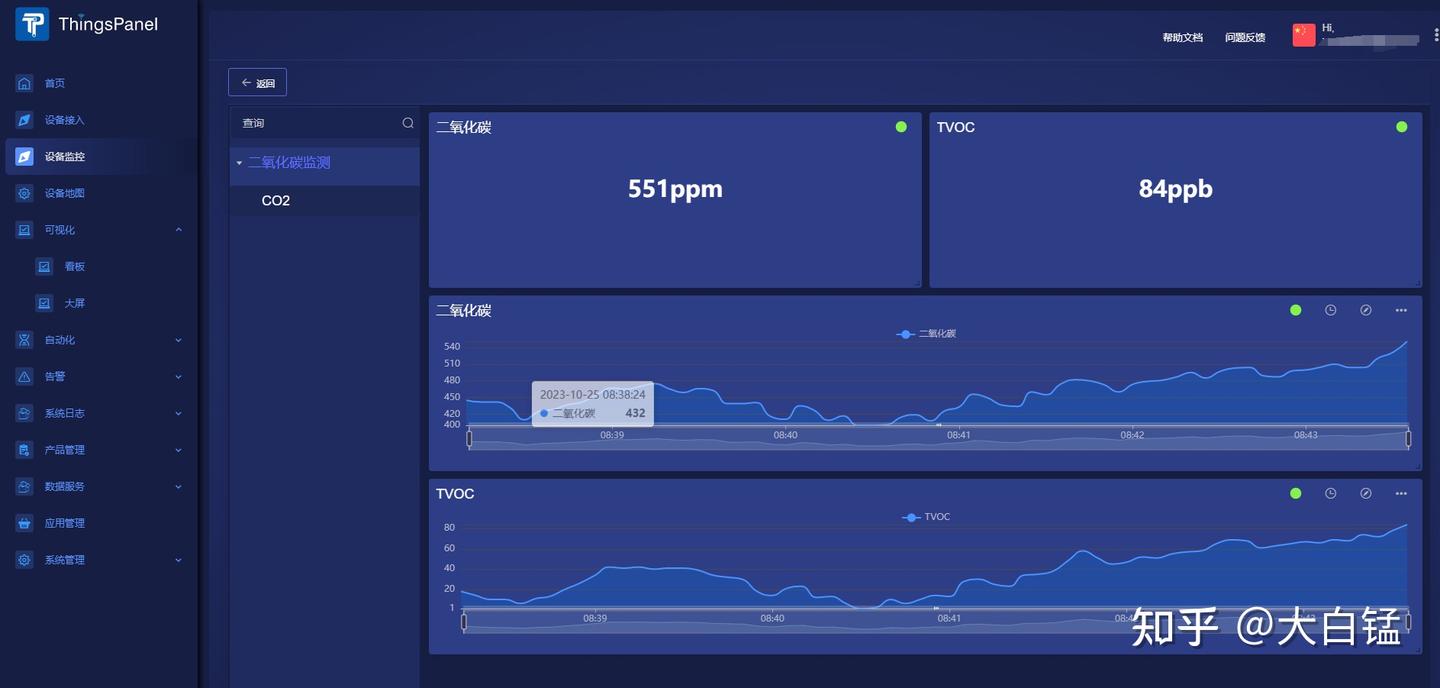
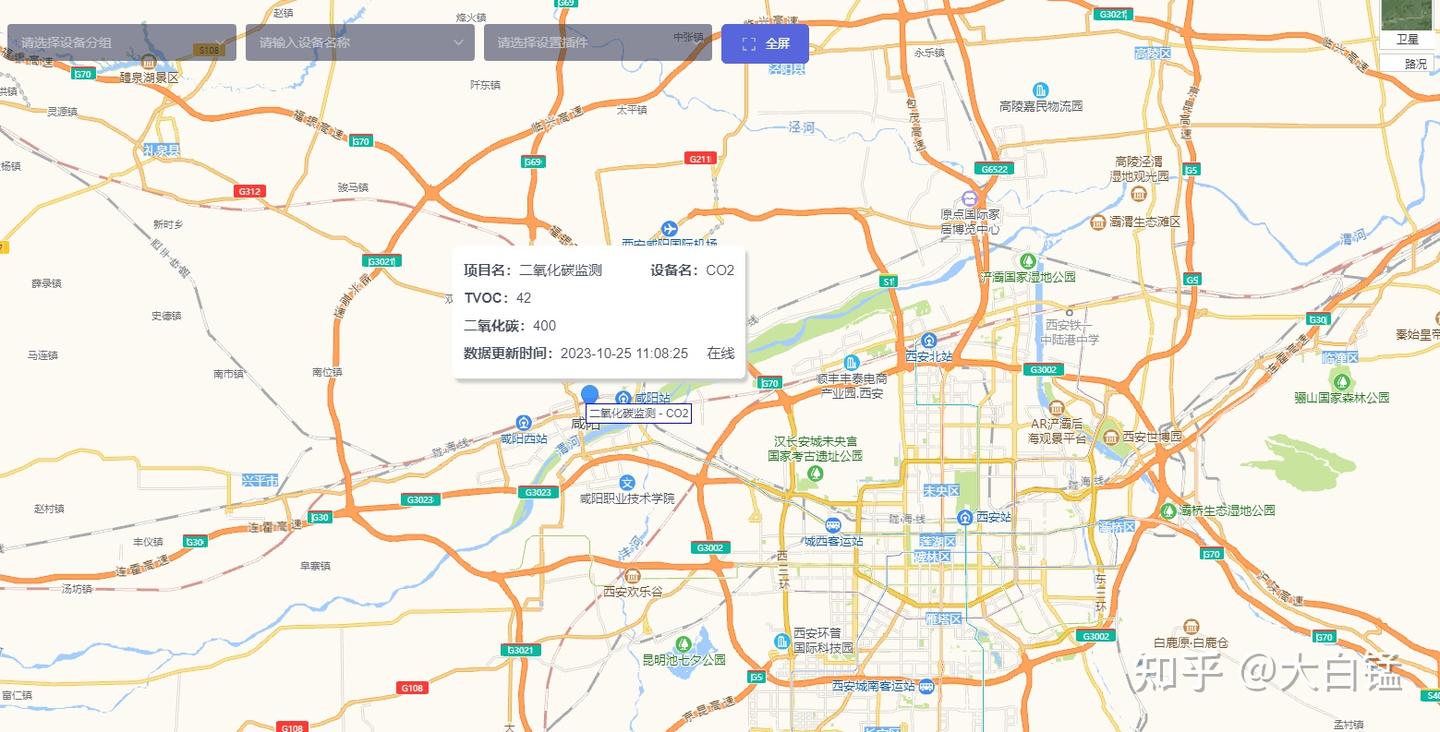
ESP32(Arduino)+SGP30+ThingsPanel实现远程CO2+TVOC监测

最近学习单片机,发现一个开源的物联网平台,虽然功能不是很完善,但完全够用。把自己目前做的记录一下。实现效果如下图(数据看板以及设备定位,坐标是我随便写的):

效果图1

效果图2

主要参考官网给的8266的例子,将代码略微改动:

1
2
3
4
5
6
7
8
9
10
11
12
13
14
15
16
17
18
19
20
21
22
23
24
25
26
27
28
29
30
31
32
33
34
35
36
37
38
39
40
41
42
43
44
45
46
47
48
49
50
51
52
53
54
55
56
57
58
59
60
61
62
63
64
65
66
67
68
69
70
71
72
73
74
75
76
77
78
79
80
81
82
83
#include <Wire.h>
#include <Adafruit_SGP30.h>
#include <WiFi.h>
#include <PubSubClient.h>
#include <ArduinoJson.h>

StaticJsonDocument<200> doc;
Adafruit_SGP30 sgp;

// WiFi和MQTT设置
const char *ssid = "要连接的wifi名";
const char *password = "WiFi密码";
const char* mqtt_server = "参考官网";
const char* mqtt_user = "参考官网";
const char* mqtt_password = ""; // 密码为空
const char* mqtt_topic = "参考官网";

WiFiClient espClient;
PubSubClient client(espClient);

void setup() {
Serial.begin(9600);

// 连接WiFi
WiFi.begin(ssid, password);
while (WiFi.status() != WL_CONNECTED) {
delay(1000);
Serial.println("连接WiFi...");
}
Serial.println("已连接到WiFi");

client.setServer(mqtt_server, 1883);

if (!sgp.begin()){
Serial.println("Failed to initialize SGP30 sensor.");
while (1);
}
sgp.begin();
Serial.println("SGP30 sensor initialized.");
}

void loop() {
if (!client.connected()) {
reconnect();
}
client.loop();

if (!sgp.IAQmeasure()) {
Serial.println("Measurement failed.");
return;
}

Serial.print("eCO2: ");
Serial.print(sgp.eCO2);
Serial.print(" ppm\t");
Serial.print("TVOC: ");
Serial.print(sgp.TVOC);
Serial.println(" ppb");

// 使用ArduinoJson生成MQTT消息
StaticJsonDocument<100> doc;
doc["eco2"] = sgp.eCO2;
doc["tvoc"] = sgp.TVOC;
char payload[100];
serializeJson(doc, payload);
client.publish(mqtt_topic, payload);

delay(1000 * 5); // 1秒
}

void reconnect() {
while (!client.connected()) {
Serial.print("尝试MQTT连接...");
if (client.connect("ESP32Client", mqtt_user, mqtt_password)) {
Serial.println("已连接");
} else {
Serial.print("失败, rc=");
Serial.print(client.state());
Serial.println(" 5秒后再试");
delay(5000);
}
}
}

上述代码中关于WiFi和MQTT设置大家参考官网文章:

ThingsPanel官网文章

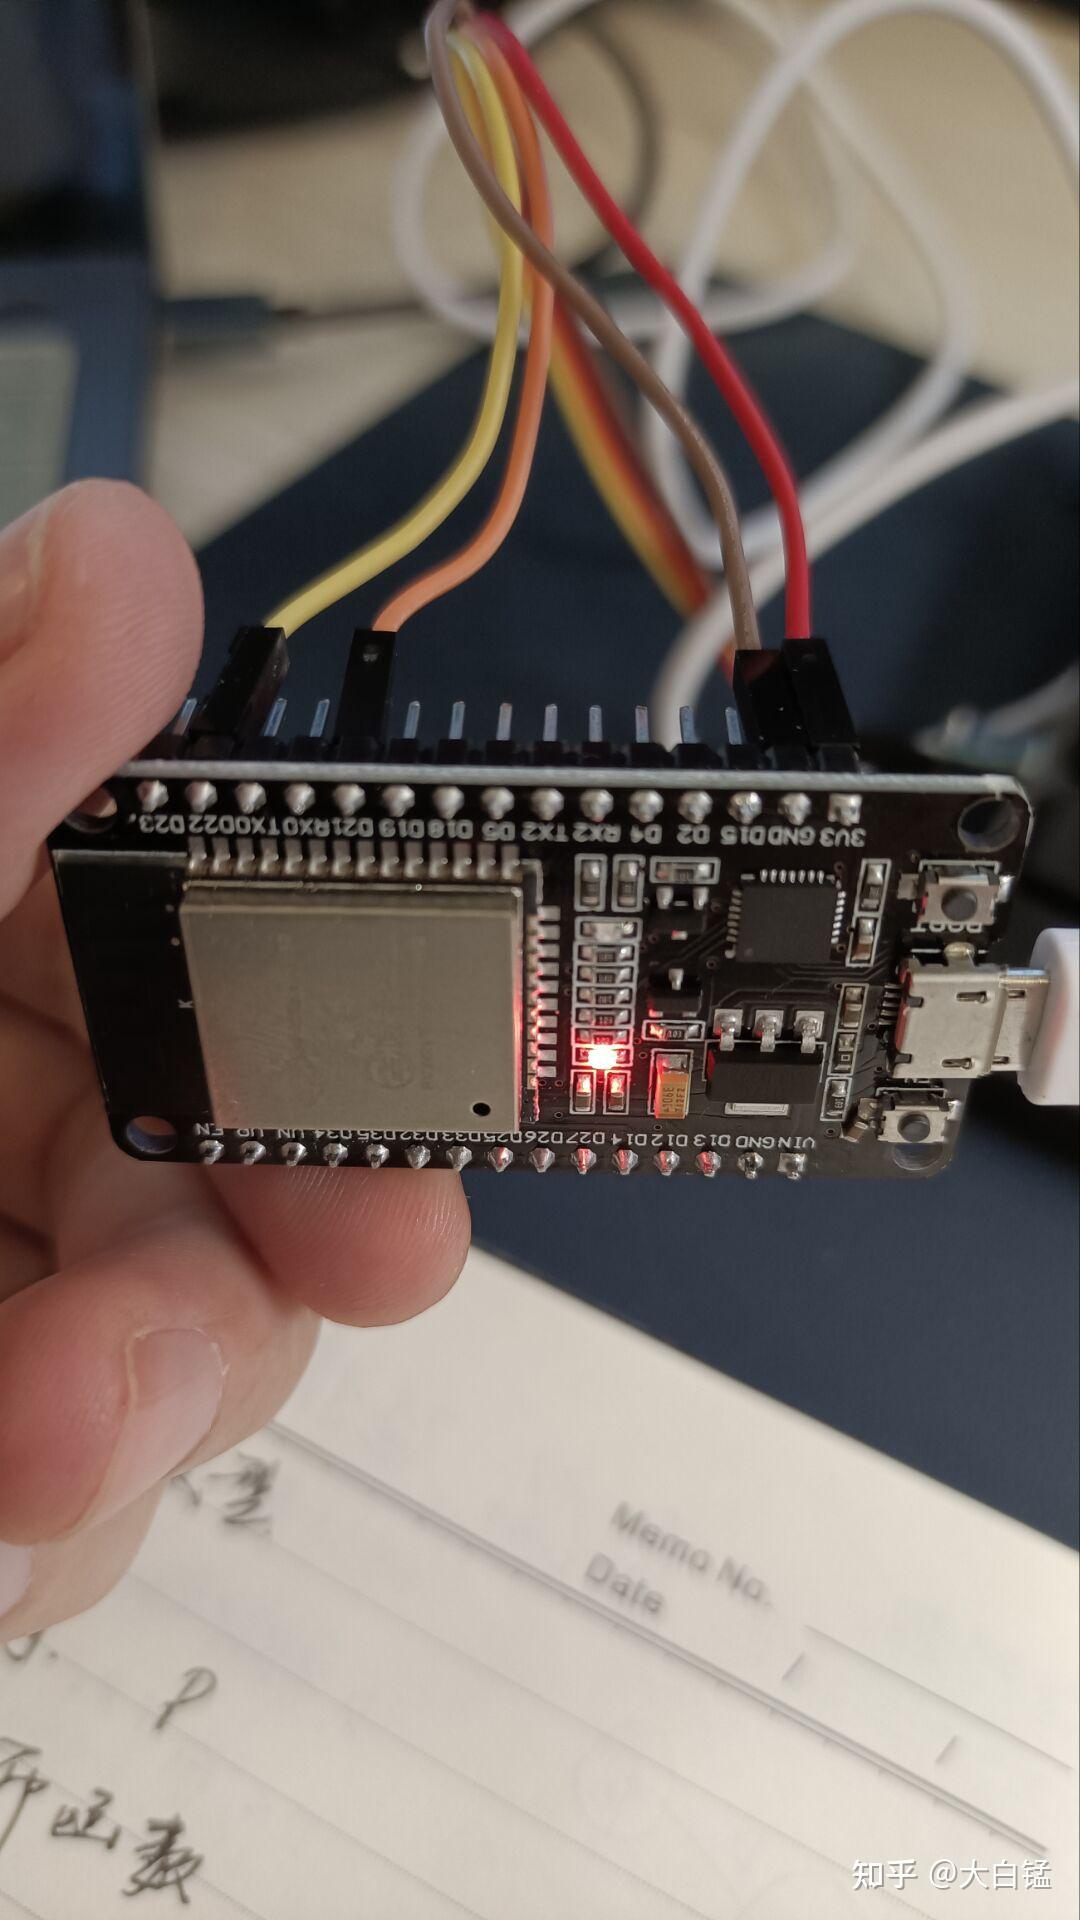
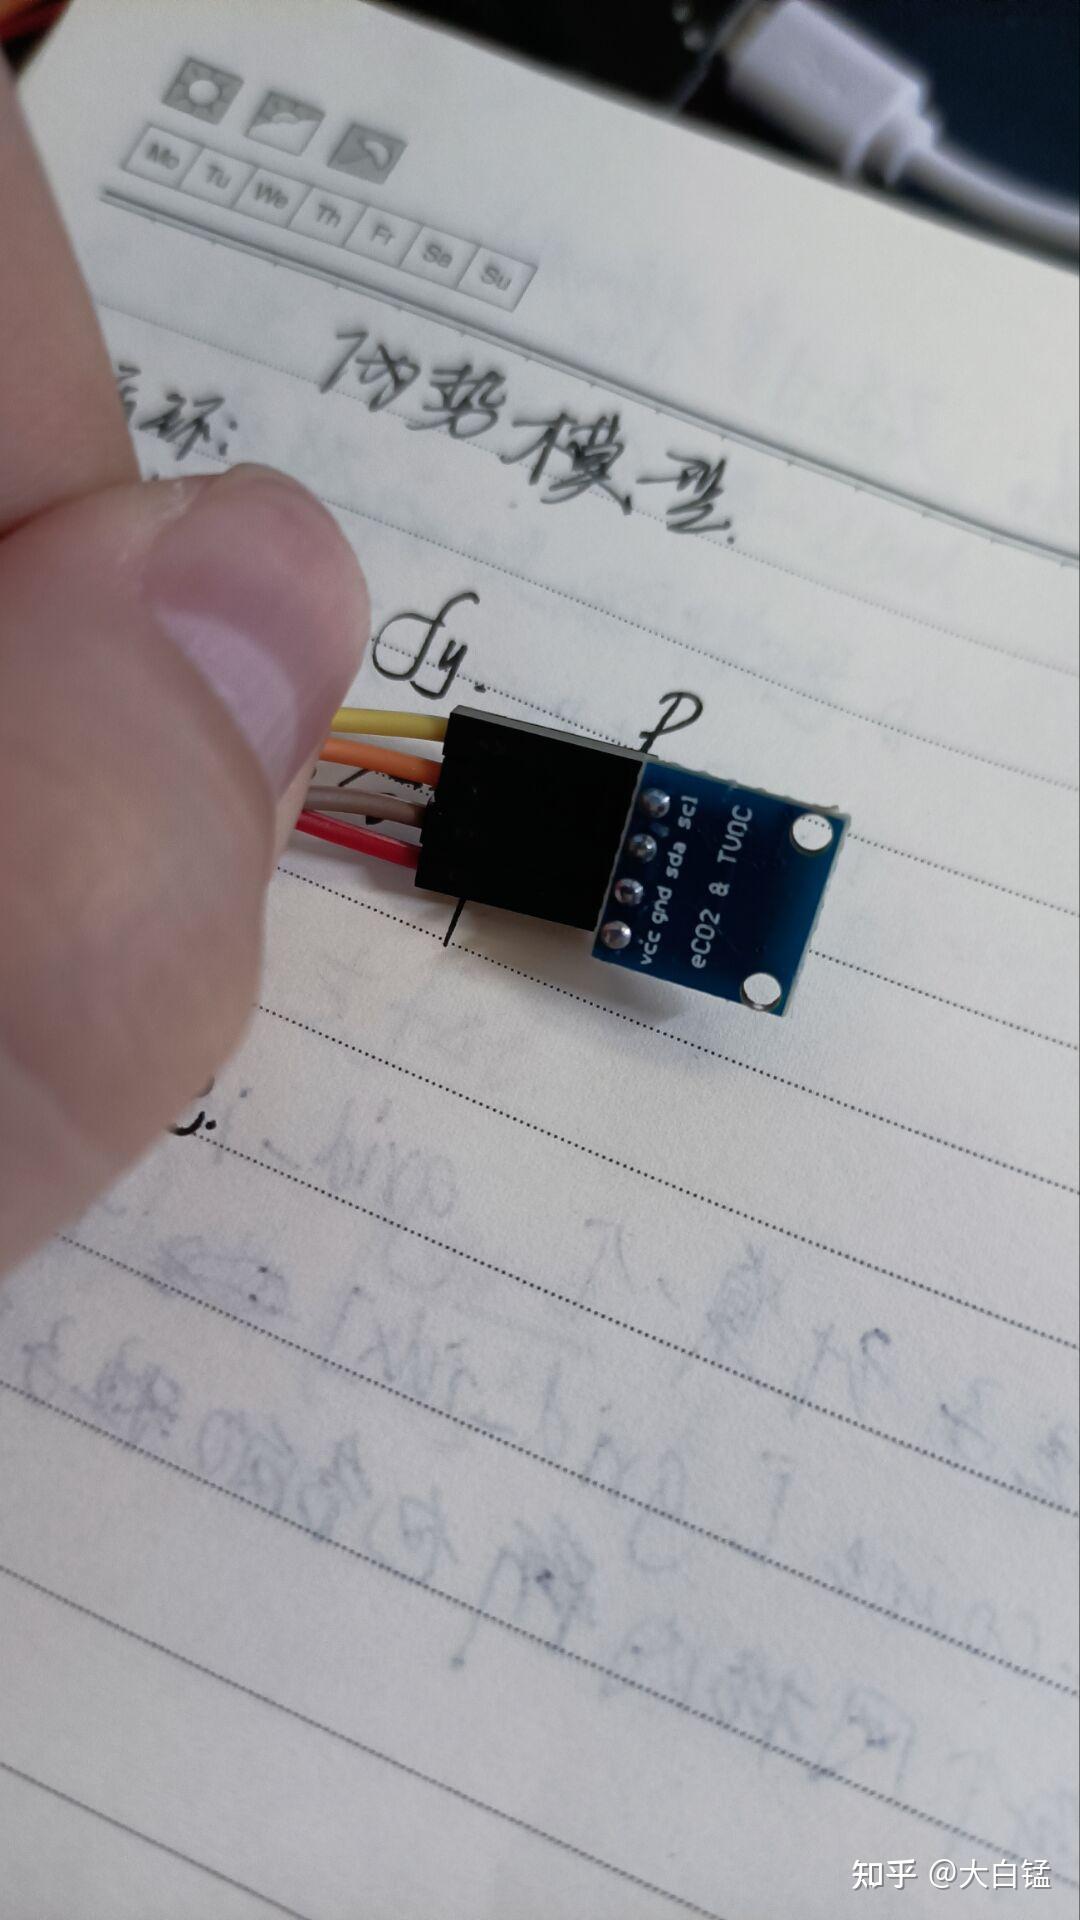
硬件连接部分:准备一个ESP32,一个SGP30传感器,四根杜邦线。

硬件连接图1

硬件连接图2

可以监测任何网络覆盖区域的CO2与TVOC值,所有数据实时传输到本地平台。下面是我用Python写的一个串口监视,用于本机监控(用了非常笨拙的方法)。

1
2
3
4
5
6
7
8
9
10
11
12
13
14
15
16
17
18
19
20
21
22
23
24
25
26
27
28
29
30
31
32
33
34
35
36
37
38
39
40
41
42
43
44
45
46
47
48
49
50
51
52
53
54
55
56
57
58
59
60
# -*- coding:UTF-8 -*-
# Author:DA BAIMENG
# Time:2023/9/15 15:46

import time
import serial
import re
import datetime
import sys
import matplotlib.pyplot as plt
import keyboard
from matplotlib.animation import FuncAnimation

plt.rcParams['font.sans-serif'] = ['SimHei']

arduino = serial.Serial("COM5")
CO2 = []
TVOC = []
time1 = []
count = 0

while True:
# time.sleep(1)
# time2 = datetime.datetime.now().strftime("%Y-%m-%d %H:%M:%S")
# time1.append(time2)
# file = open('data.csv', 'w')
# file.write(str(CO2) + '\n')
# file.write(str(TVOC) + '\n')
# file.write(str(time1) + '\n')

bytes_data = arduino.readline()
string_data = bytes_data.decode('gbk')
print(str(string_data))
count = count + 1

if count >= 5:
try:
values = re.finditer(r'\d+', string_data) #获取字符串中的数字
s1 = []
for match in values:
s1.append(match.group())#将获取的数字加入临时列表
CO2.append(int(s1[1]))
TVOC.append(int(s1[2]))

# 绘制图形
plt.clf()
plt.subplot(2, 1, 1)
plt.plot(CO2)
plt.ylabel("CO2浓度 / ppm")
plt.subplot(2, 1, 2)
plt.plot(TVOC)
plt.ylabel("TVOC浓度 / ppb")

# 不显示图形
plt.ioff()

# 更新图形
plt.pause(0.01)
except :
break

效果:
知乎原文


自制二氧化碳监测平台
http://example.com/2025/03/12/自制二氧化碳监测平台/
作者
DABAI MENG
发布于
2025年3月12日
许可协议